Analysis of Sales Data Visualization of Warung Indomie using the Looker Studio Platform
DOI:
https://doi.org/10.63017/jdsi.v3i1.33Keywords:
Warung Indomie, Sales, Looker Studio Visualization, Best-Selling ProductsAbstract
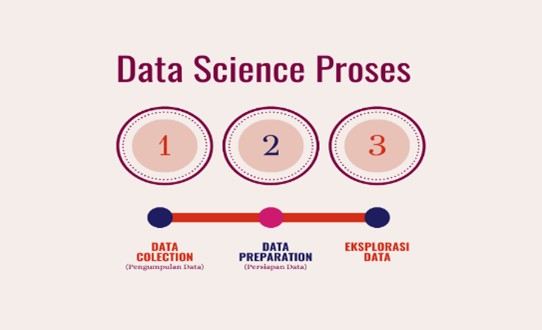
Indomie stalls are stalls that serve noodles from Indomie products.because people's tastes are very familiar with indomie, the opportunity to do business in the field of warmindo is large.so research was carried out to analyze the sales data of the indomie stall. The method used is Sales Data Visualization Analysis at Indomie Warung Using the Looker Studio Platform, starting from data collection, data preparation and data exploration. The data taken is secondary data from the Bima Putra website. The attributes used are invoice_id,tanggal_transaksi, jenis_produk, quantity, harga_jual, jenis_pembayaran, jenis_pesanan, and nilai_penjualan.so as to produce several visualizations. From this visualization, it is known that the best-selling Indomie product type is Indomie soup with 682 sales and the non-selling product is Indomie Goreng which sold only 293 from January-August 2022. The favorite product is Indomie Soto Betawi flavor as many as 80 sales. With the overall indomie flavor is 18 flavors. For the type of orders that are widely made, delivery is 51.7% with cash payment, which is 20%.the highest monthly income is July 2022 with a total of 1.4 million and the lowest is April 2022 with a total of 899 Rp. With an overall total of 975 sales. Therefore, this indomie stall can pay attention so that the stock of best-selling goods is always available, increase the promotion, improve the service, comfort and facilities of the stall, and of course the taste of the indomie dish should attract customers. Because the factors that cause the success or not of the business come from the number of sales.In addition, from this information, customers can also know which products can be recommended.
References
N. Husin, "Web-based Grocery Wholesale Ordering System at Indra Stores East Jakarta," J. Essence of Infokom J. Essence of Sis. Inf. and Sist. Comput., vol. 4, no. 1, pp. 19–24, 2020, doi: 10.55886/infokom.v4i1.316.
D. I. Indrako and R. Gusrizaldi, "Analysis of Factors Affecting Sales Levels at Indrako Swalayan Teluk Kuantan," Currency, vol. 2, no. 2, pp. 286–303, 2016.
L. Sutiani, "5 Examples of Sales Data and Its Benefits for Business," Compas. Accessed: Jun. 29, 2024. [Online]. Available: https://compas.co.id/article/contoh-data-penjualan/
Z. Arfandi, B. Yanto, K. Sabri, Y. Aini, and Adynatalubis, "Analysis of Sales Data Visualization and Sales Satisfaction Level Using the Lookerstudio Platform," Riau J. Comput. Sci., vol. 10, no. 1, pp. 38–45, 2024.
F. Irawan Zai, S. Riki Mustafa, Y. Aini, A. Setiawan, and M. Dwi Sena, "Bigquery Visualization of Grocery Store Sales Data Using Locker Studio Flatform," Riau J. Comput. Sci., vol. 10, no. 1, pp. 46–52, 2024, [Online]. Available: www.kaggle.com
M. Fitri, J. Jamalludin, and C. WM Vermila, "Analysis of Consumer Satisfaction with Basic Food Products at Juan Minimarket in Benai District, Kuantan Singingi Regency," Optima, vol. 3, no. 1, 2019, doi: 10.33366/optima.v3i1.1251.
Johannes Kurniawan, Data Analysis and Visualization, vol. 3, no. 1. 2023. [Online]. Available: https://medium.com/@arifwicaksanaa/pengertian-use-case-a7e576e1b6bf
A. R. Sitoresmi, "Secondary Data Is a Pre-Existing Source, Understand the Definition and Examples," coverage6. Accessed: Jun. 29, 2024. [Online]. Available: https://www.liputan6.com/hot/read/5163230/data-sekunder-adalah-sumber-yang-telah-ada-sebelumnya-pahami-definisi-dan-contohnya?page=4
R. Tineges, "Getting to Know the Types of Analysis with Secondary Data Analysis Methods," DQlab. Accessed: Jun. 29, 2021. [Online]. Available: https://dqlab.id/mengenal-macam-analisis-dengan-metode-analisis-data-sekunder
D. Aryanti and J. Setiawan, "Visualization of Sales and Production Data of PT Nitto Alam Indonesia for the Period 2014-2018," Ultim. InfoSys, vol. 9, no. 2, pp. 86–91, 2019, doi: 10.31937/si.v9i2.991.
F. Donny, "Data Visualization Using Google Data Studio," Semin. Technol Engineering. Inf., 2018, [Online]. Available: 808-Article-Text-2434-2-10-20181217
D. Fadhillah, B. Yanto, M. Arif, and A. Zulkifli, "Implementation of Google Data Studio for Divorce Data Visualization in Jambi in 2020 in the Form of a Dashboard," RJOCS (Riau J. ..., vol. 10, no. 1, pp. 14–20, 2024, [Online]. Available: http://journal.upp.ac.id/index.php/rjocs/article/view/2410%0Ahttps://journal.upp.ac.id/index.php/rjocs/article/download/2410/1352
M. Fatma, "Electronic Contracts in Legal Protection for Online Buying and Selling Consumers (E-Commerce)," White Elephant J. Econ. Rev.., vol. 4, no. 1, pp. 64–69, 2022, [Online]. Available: https://id.scribd.com/document/729203633/269-Article-Text-1164-2-10-20220805
N. Azis, A. J. Wahidin, P. A. Cakranegara, A. Muditomo, and E. Efendi, "Visualization Of Tourist Visit Time Series Data Using Google Data Studio," J. Logic, vol. 6, no. 2, pp. 2153–2159, 2022, [Online]. Available: http://www.iocscience.org/ejournal/index.php/mantik/article/view/2731
C. Perdana, Usep Abdul Rosid, and Bian Austin Okto, "Visualization of Immovable Asset Data Using Looker Studio at PT XYZ," J. Inform., vol. 3, no. 1, pp. 37–44, 2024, doi: 10.57094/ji.v3i1.1607.
F. Fahrizal, B. Irawan, and A. Bahtiar, "Analysis of Best-Selling Products and K-Means Testing for 'Cetom MSMEs,'" JATI (Journal of Mhs. Tek. Inform., vol. 8, no. 3, pp. 3055–3061, 2024.

Downloads
Published
How to Cite
Issue
Section
License
Copyright (c) 2025 Data Science Insights

This work is licensed under a Creative Commons Attribution-NonCommercial 4.0 International License.


 SUPPORT


